Home Automation: Setting up Monitoring Services

In my previous article I set up my raspberry pi, some basic applications, and a docker service running Gitea locally. Today I am continuing the process of setting up the environment and server that will support future home automation projects. This article will be about setting up Prometheus and Grafana to monitor the services I set up on the raspberry pi.
Prometheus is an open-source systems monitoring and alerting toolkit originally built at SoundCloud. Its components are written in Go and since its inception in 2012, many companies and organizations have adopted Prometheus Source
Prometheus works by scraping metrics on a fixed schedule and offers a query language to filter and aggregate the data.
My first step will be to set up docker containers for Prometheus and a default node-exporter in order to collect metrics from the Raspberry Pi host. I will be using docker compose to manage both containers. via Docker Compose
Inside the infrabox/prometheus directory I will be creating a prometheus.yml file to configure the Prometheus server. The configuration file will be used to scrape the node-exporter metrics. Inside the prometheus.yml file I will add the following configuration.
infrabox/prometheus/prometheus.yml
---
global:
  scrape_interval: 15s
  scrape_timeout: 10s
  evaluation_interval: 15s

alerting:
  alertmanagers:
    - follow_redirects: true
      enable_http2: true
      scheme: http
      timeout: 10s
      api_version: v2
      static_configs:
        - targets: []

scrape_configs:
  - job_name: prometheus
    honor_timestamps: true
    scrape_interval: 15s
    scrape_timeout: 10s
    metrics_path: /metrics
    scheme: http
    follow_redirects: true
    enable_http2: true
    static_configs:
      - targets:
          - localhost:9090

  - job_name: svc_discovery
    file_sd_configs:
      - files:
          - "/prometheus/sd_*.json"
With this configuration I can add new target systems by creating a new job file using the prefix sd_ and the file extension .json. The file will contain the target system's IP address and port. Below is an example of a job file for a node-exporter running on a Raspberry Pi.
infrabox/prometheus/sd_node01.yml
---
- labels:
    job: node01
  targets:
    - "rpi-host:9100"
Here is the docker-compose file that will be used to start the Prometheus and node-exporter containers. The node-exporter container will be running in host network mode to collect metrics from the Raspberry Pi host.
infrabox/prometheus/docker-compose.yml
version: '3'
services:
  prometheus:
    image: quay.io/prometheus/prometheus:v2.45.0
    restart: always
    volumes:
      - "prom_data:/prometheus"
      - "./prometheus.yml:/etc/prometheus/prometheus.yml:ro"
    ports:
      - 9090:9090
    networks:
      - prom_net
    extra_hosts:
      - "rpi-host:192.168.38.1"

  node:
    image: quay.io/prometheus/node-exporter:v1.6.1
    command:
      - "--path.rootfs=/host"
    pid: host
    restart: always
    volumes:
      - "/:/host:ro,rslave"
    expose:
      - 9100
    network_mode: host

volumes:
  prom_data: {}

networks:
  prom_net:
    driver: bridge
    ipam:
      config:
        - subnet: 192.168.38.0/24
          gateway: 192.168.38.1
I realize it is a bit dry to include all these configuration files but I wanted to give the details. 🙂
Once we start the containers I can check out the Prometheus web interface at http://localhost:9090. Until I run a command to copy the node-exporter job file to the Prometheus container I will not see any metrics. I will run the following command to copy the job file to the Prometheus container and wait for the service to appear.
docker cp sd_node01.yml prometheus-prometheus-1:/prometheus
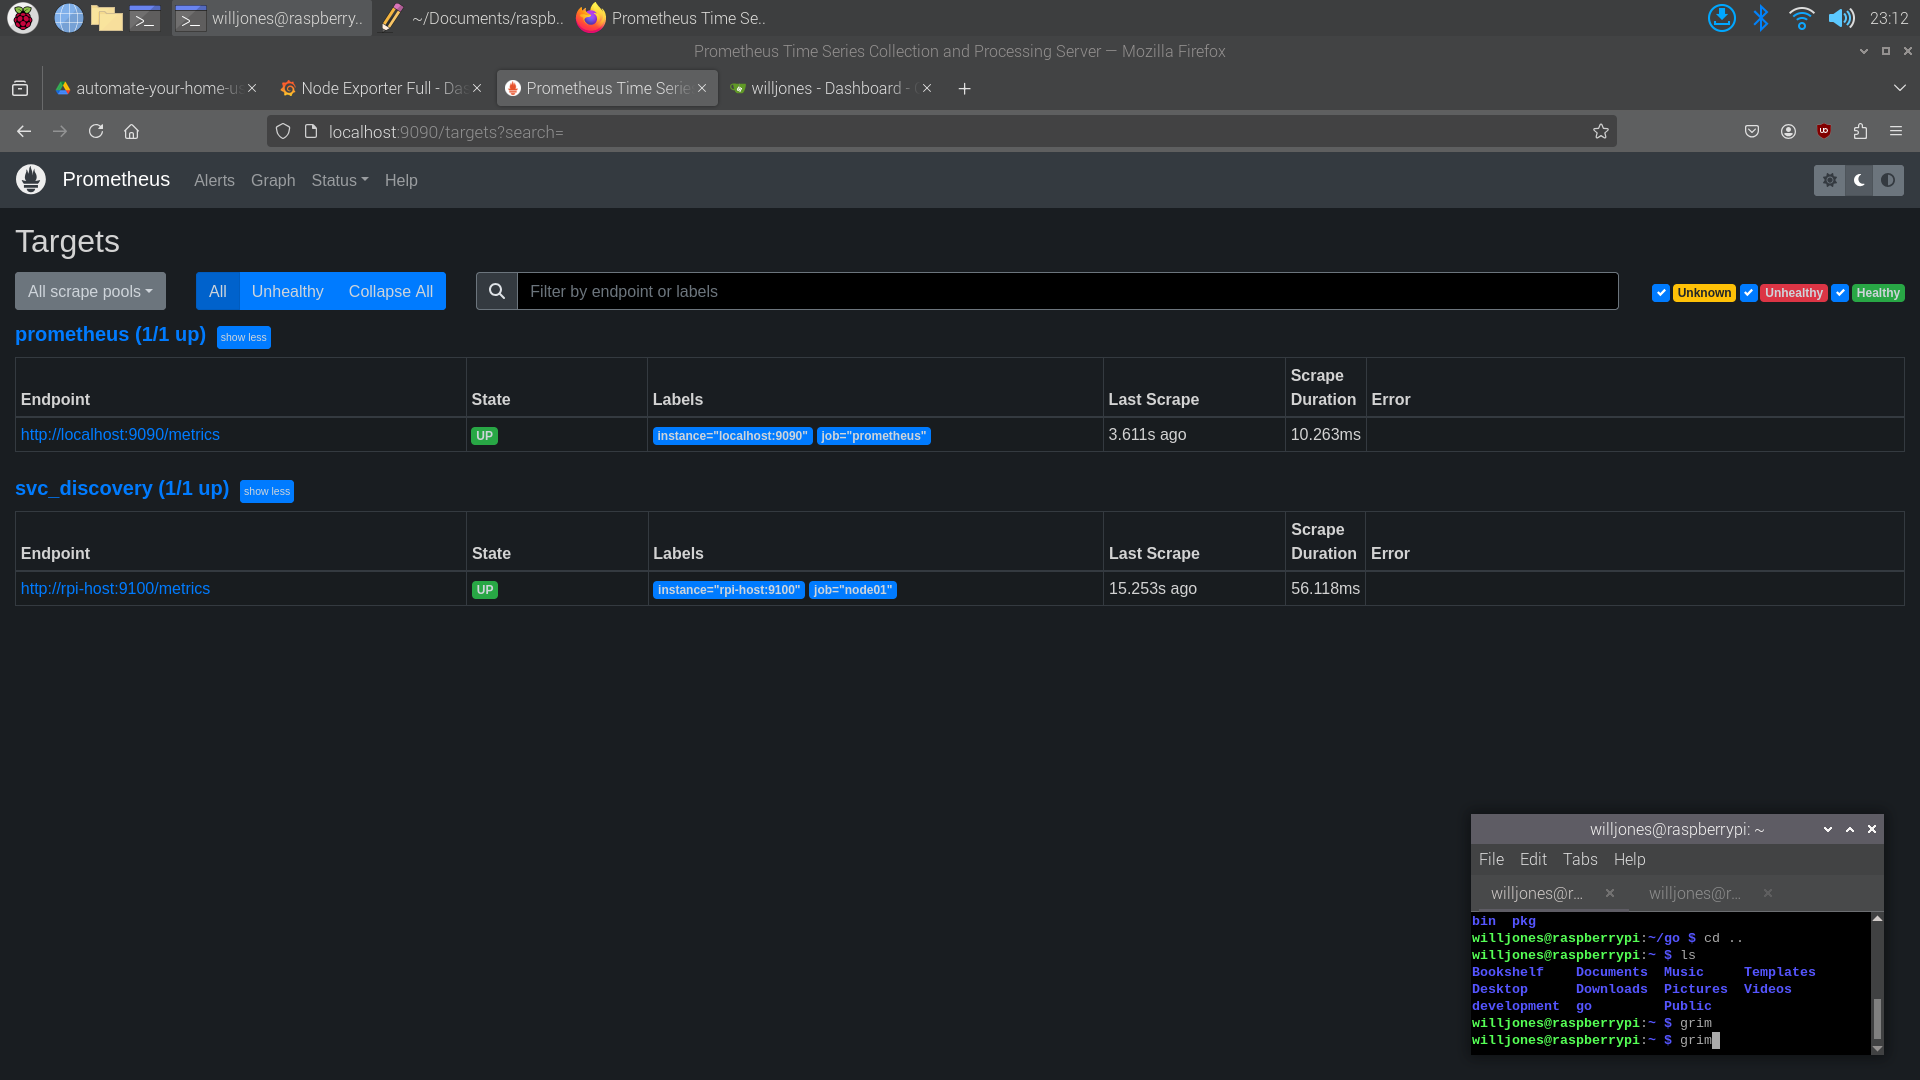
With the command running I can now see the new target in the Prometheus interface. In Prometheus one can search through the array of metrics gathered by the node-exporter but the data is hard to navigate. Prometheus does offer some graphs to display metrics but Grafana is a better tool for data visualization.

Grafana is an open-source tool for visualizing data developed in Go. It can be used to create dashboards with graphs and tables to display metrics. Grafana allows users to install pre made dashboards from JSON configuration files which is what I will be doing today.
I will be setting up a Grafana container to connect to the Prometheus server. I will be using the official Grafana docker image and a docker-compose file to manage the container this can be done with the following command.
$ docker run -d \
--name=grafana01 \
--restart=always \
--net=prometheus_prom_net \
-p 3100:3000 \
docker.io/grafana/grafana-oss:9.5.6
After adjusting the Grafana configuration to connect to the Prometheus server I can now access the Grafana web interface at http://localhost:3100. Once logged in I can add a new data source to connect to the Prometheus server which will allow Grafana to start to collect metrics.
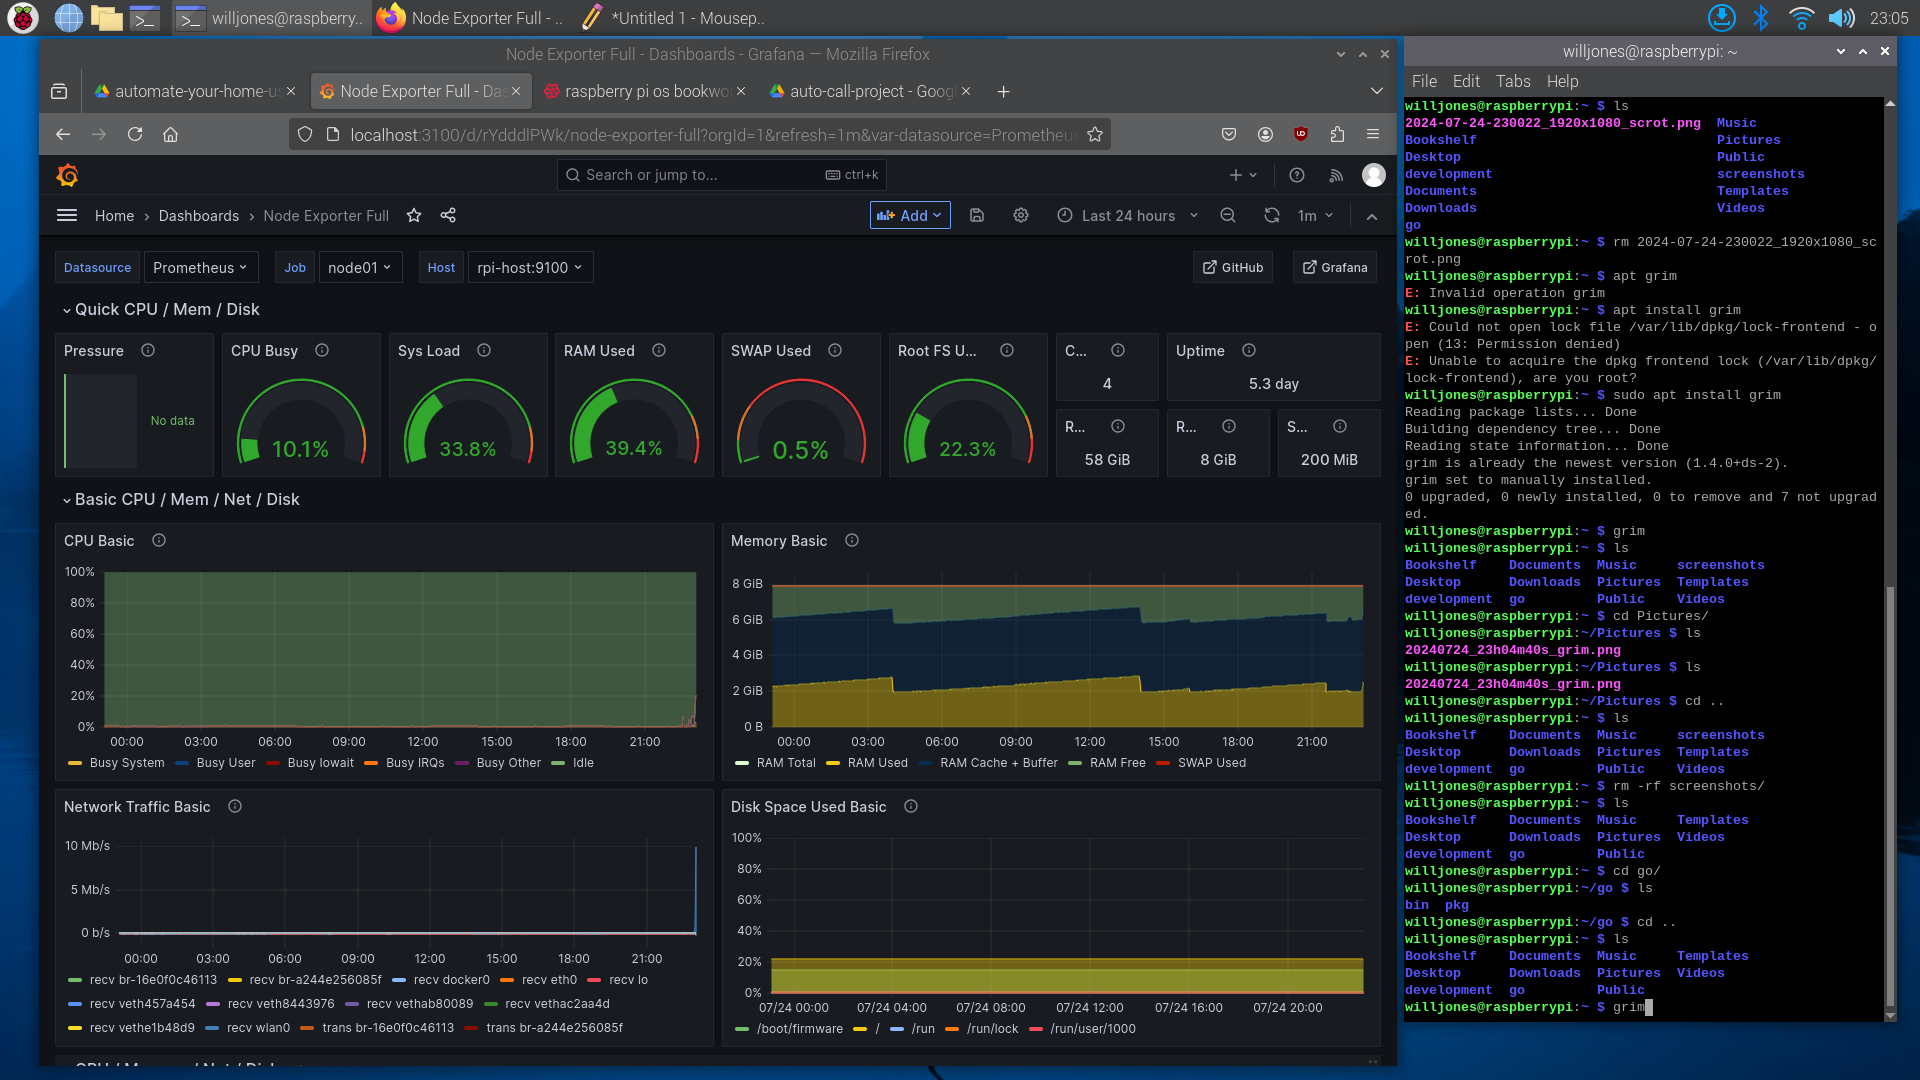
I will be using this pre-made dashboard for node-exporter to display the collected metrics.

At this point I have my basic IT infrastructure setup and the book informs me that I can continue to run containers to support my future projects. The first project is a temperature monitor to send alerts anytime it gets too hot or too cold in a certain setting. Excited for the first project! Temperature Monitor 🌡️
Thankful for the exercise of technical writing. This helps me clear up my own thoughts and develop a deeper understanding for the topics I am learning. 🙏
Until next time. 🤘